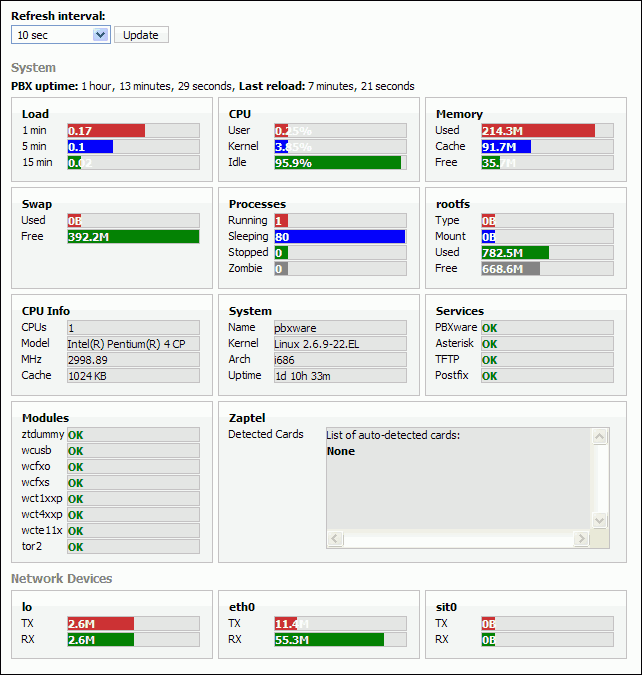
|
Refresh Interval:
|
Time interval in seconds at which data is to be refreshed |
10 sec |
Select box |
|
PBXware Uptime:
|
Total time PBXware is available for service |
1 hour, 16 minutes, 42 seconds |
Display |
|
Last Reload:
|
Total time since PBXware was last reloaded |
10 minutes, 34 seconds |
Display |
|
Load:
|
Load shown for past 1, 5 and 15 minutes |
0.16 |
Display |
|
CPU:
|
CPU usage by: user, kernel and idle |
2.3% |
Display |
|
Memory:
|
Memory usage by: Used, Cache and Free |
299.1M |
Display |
|
Swap:
|
Swap space usage |
5.2M |
Display |
|
Processes:
|
Processes by Running, Sleeping, Stopped and Zombie |
1, 96, 0, 0 |
Display |
|
rootfs:
|
File systems present shows by type, mount, usage and free status |
0B, 0B, 3.3G, 1.5G |
Display |
|
CPU Info:
|
Number of CPU's, Model, Speed and Cache size |
Pentium II (Deschutes), 398.28, 512KB |
Display |
|
System:
|
General system details like Name, Kernel, Architecture and Uptime |
zenica.bicomsystems.com, Linux 2.4.21-27.0.1.EL, i686, 18d 1h 35m |
Display |
|
Services:
|
Default system services running on the system |
PBXware, Asterisk, TFTP, Postfix |
Display |
|
Modules:
|
Currently loaded ZAPTEL modules |
wsusb |
Display |
|
Zaptel:
|
A list of all cards detected by the system is displayed here.
Channel Map displays used slots on TDM card. In this case first slot is filled with FXO module (displayed in black) while other 'Empty' slots are displayed in gray color.
|
Channel Map: 1: FXO, 2:FXS, 3:Empty, 4:FXO |
Display |
